Building a business intelligence strategy is the foundation to curating a highly effective data-driven organization. A well-crafted strategy will ensure that you have the proper tools and processes in place to handle some of the toughest data challenges and deliver on-time and actionable insights.
Whether you’re starting from scratch or looking for that extra piece to push the needle of your existing strategy, you will find something to integrate into your approach here.
What is Business Intelligence?
Business intelligence is the use of software and services to transform data and turn it into actionable insights through dashboards and reports. The sole purpose of Business Intelligence within an organization is to help businesses make more informed decisions.
How to create a BI Strategy
Building out a BI strategy that actually drives impact in a business isn’t an easy task. In fact successful strategies often don’t happen the first time.
It takes constant learning and implementation to begin delivering impact and building the data-driven organization you set out for. In this guide, we offer a framework that will help you skip a lot of the nonsense and start off with the things that really matter.
Before we dive in, keep in mind that every business is different. Make sure when you’re developing your strategy, to apply it to the context of your specific business objectives.
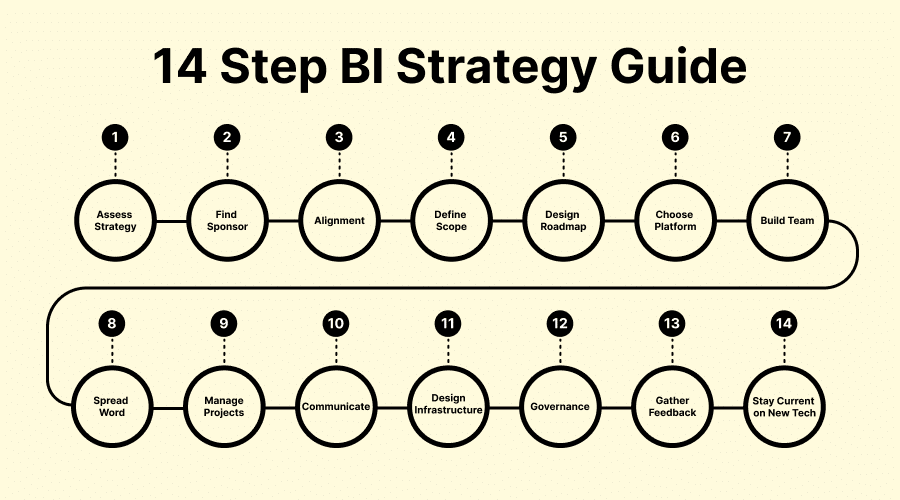
1. Assess your existing strategy
Where are you currently at on your data journey? If your organization already has a strategy, and you’re just looking to revamp your approach, then you probably have a good idea of what’s worked and what hasn’t. Take the time to document these insights.
Maybe your presentation approach failed to hit home with stakeholders or your time-to-delivery has increased. Keep this information at hand and reference it when writing your new strategy.
2. Find a sponsor
A sponsor is an individual in the executive level or c-suite that you will communicate with regularly to help ensure the data teams initiatives align with company objectives. Moreover, this individual will be an advocate for data within the organization and help encourage the use of data across the business.
How do you choose a sponsor?
If your company has a Chief Data Officer, that would be your sponsor. If not, you might need to seek out another executive to play the role, such as the CEO, COO, or CRO depending on the size of your company and level of data adoption.
3. Align with key stakeholders
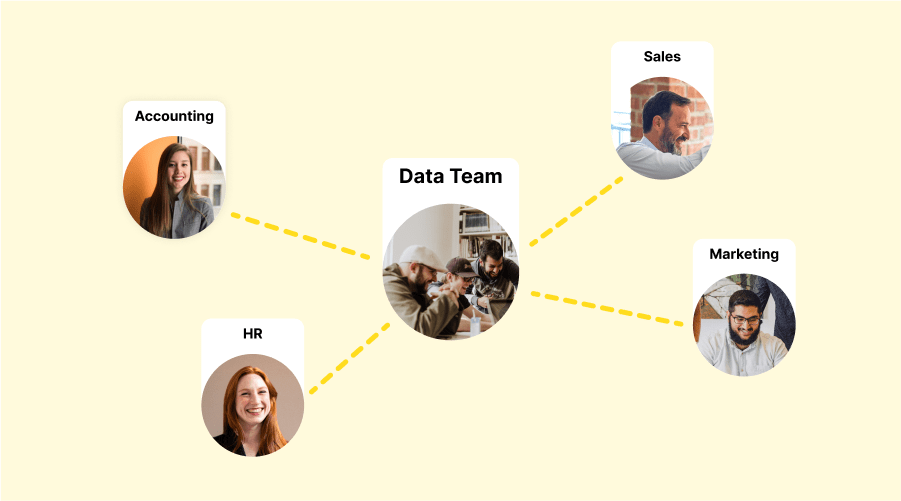
Stakeholders are people within the company who actively use data to make decisions. Stakeholders are typically directors or managers of a department, and will be the data teams main point of contact into that department.
It’s important to set up an introduction meeting with stakeholders to identify their needs. Make sure to ask questions so that you can understand primary KPIs, goals, data sources, and more.
Building trust is one of the most important pieces to fostering strong and effective stakeholder relationships.
Here are a few tips that you can apply:
- Shared meeting notes
- Access to view status and timelines on related projects
- Ask important questions to ensure you understand their needs
- Be upfront about what they can expect from the team
- Make sure to follow through on all commitments
- Own your mistakes
4. Define your scope
Defining the scope will be your backbone when building out your BI strategy. During this step, it’d be wise to work closely with your sponsor to ensure all company objectives are covered.
Here are some questions that you will want to answer in your scope:
- What is the primary goal of business intelligence in our business?
- What defines success?
- How will BI align with company objectives?
- How is BI going to fit in with our day-to-day operations?
- What departments will be using BI? Do any of these departments take precedence over another?
- What are our main KPIs and what identifies success?
- What data resources do we need to tackle this, and who will play these roles?
The answers to these questions will help guide your strategy and can be a great reference point when you’re feeling lost with your data initiatives. However, don’t feel like you have to be stuck to the boundaries of your scope. Things are rapidly changing so feel free to adjust as your business grows and needs change.
5. Build a roadmap
Now that you have defined the scope, you can get to work mapping out exactly what you’re going to get done. When you have meetings with sponsors or stakeholders, a roadmap will help you communicate what can be expected to come through the pipe and when.
First things first, ask yourself this: “What’re the most important tasks and what should I tackle first?”
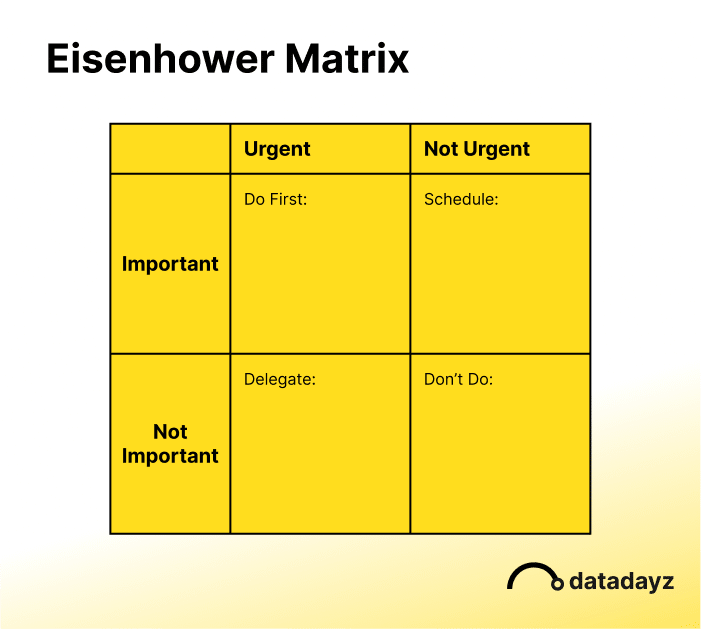
To help you answer this question, you might consider using a framework for decision making called the Eisenhower Matrix. The Eisenhower Matrix is made up of four quadrants and categorized by importance and urgency.
Add tasks into the quadrant where it best fits. The tasks that are most important and urgent will be the first tasks you do. The important but not urgent tasks will be scheduled out. The not important but urgent tasks can be delegated out. The ones that aren’t important and not urgent aren’t high enough priority to do.
Check out the example below:
6. Choose a BI platform
Now that you’ve defined the scope, it’s the perfect time to start the hunt for a BI tool – that is if you don’t have one already. Every BI tool is different, so your scope will help guide you to finding the optimal software for your unique needs.
There are dozens of great BI tools with varied functionality. As a starting point, I’d suggest looking at the following tools:
1. Domo
2. Tableau
3. Power BI
Find a tool that is flexible and provides you with plenty of room for growth. You can start small and add additional functionality as you grow and your data needs expand.
Consider using a decision matrix to help you choose the right platform. Ruminate.io is a free tool that will help you quantify your decision and easily come to a solution.
7. Build your team
Building your data team isn’t going to happen overnight. There are various things to consider, such as how they might fit with company culture, whether or not their experience aligns with the skills you need, etc.
Sometimes the best data hires happen internally. Someone from the inside who might have experience working with data, or are interested in making the transition can be a great bet because they can provide business and subject matter expertise that someone from the outside can’t offer from the get go.
As the demand for data within your organization grows, and your company decides to allocate additional resources to growing the BI department, keep these critical roles in mind and decide what needs align most with company objectives.
8. Spread the word
Get the word out about data within the organization and build a strong culture. Work with your sponsor to generate some creative ideas to teach people about the importance of data and how to act on it.
Host trainings
Not everybody is able to understand and turn data into actionable insights right out of the gate. Work with your sponsor to generate a training plan for helping people access, understand, and make data actionable.
Here are some ideas for hosting trainings:
1. Live video trainings are a great way to train people because you can share your screen and record the training so that you can blast it out to people who didn’t have the opportunity to attend.
2. Pre-recorded trainings are great for introductory topics and on-boarding – the kind of videos that are going to be viewed the most.
3. In-person trainings are a great way to connect with people face-to-face. Often, these hands-on interactions spark conversations that might otherwise have not occurred.
Real-time dashboard screens
Big flashy dashboards on TV screens are not only a great way to get important metrics in front of the company, it’s also a great opportunity to make people aware of the possibilities available.
Although self-serve analytics is all the buzz these days, it does require you to log in and sift through dashboards. Screens are a great way to get the most important information in front of people with minimal effort.
Furthermore, data can be a bit intimidating for people who are new to working with data. When designed and distributed effectively, screens can be a great starting point for data newbies.

9. Project management
Project management is a vital component to the Business Intelligence process. This is where you will take the strategy that you’ve built and start planning out your tasks and adding timeframes.
The project management process will help you stay on track and manage your entire process from beginning to end. Your sponsor and stakeholders will also be able to glean in and see the status of their projects.
A popular framework for delivering projects is the agile methodology. This framework consists of 5 main steps:
1. Plan
2. Design
3. Develop
4. Test
5. Deploy
Because the data analysis process can have some loop holes to derive exactly the right information you need, an iterative process such as agile is a perfect fit.
Click Up and Monday are both great tools for managing BI projects. They each have highly customizable templates to fit your project management methodology, whether that’s agile, waterfall, or SCRUM.
10. Communication
Have you ever taken hours or days cleaning data, creating reports, and presenting them to stakeholders just for them not to take action? You probably did a great job at the doing the research but fell short communicating the findings and impact on the business.
The ability to effectively communicate insights to stakeholders will be a foundational piece to the data teams success. Teams that don’t prioritize proper communication risk high-impact insights going by the wayside if not communicated in a way that is easily understood.
What does effective communication look like?
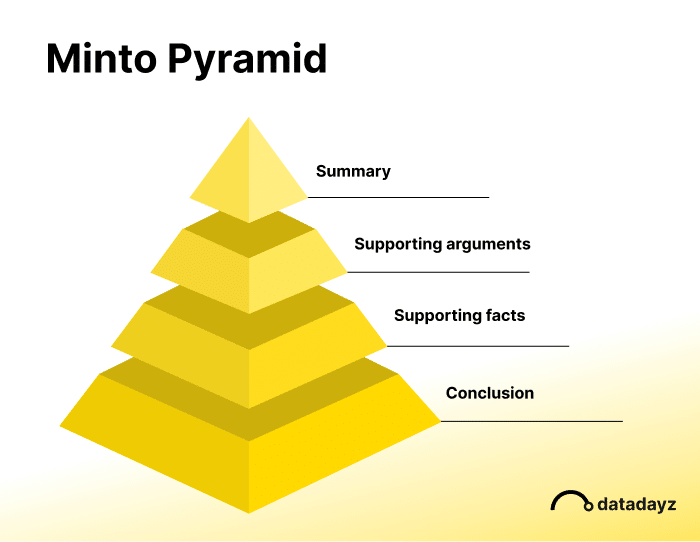
You should consider adopting a framework that suits your business and helps you get the point across. A popular approach for deliver analytical insights is the Minto Pyramid.
Here is how the Minto Pyramid can be applied to your analytics project:
First, you want to communicate the summary of your story at the very beginning. Second, provide your audience with the key arguments of your story. Third, present supporting evidence for your arguments. Fourth, summarize your main point again.
The key is to not get carried away with too much detail. The goal of the Minto Pyramid is to keep things straight to the point so that your audience doesn’t miss the point.
11. Design your data infrastructure
It’s important to understand the kind of data that you will be analyzing and where the data is coming from. Data can come from a variety of sources that will require different methods for getting it into your BI tool of choice.
Because you have already met with stakeholders and received information about their data needs, you probably have a pretty good idea what your data infrastructure will consist of.
Your data infrastructure should enable you to ingest, store, secure, retrieve, and analyze your data with minimal effort. If you choose a tool such as Domo, you can handle all of these moving elements on a single platform.
12. Governance
A data governance plan is a set of rules that define processes for collecting, storing, and using data. Your organization’s policies, rules, and definitions will be unified with the help of a data governance framework. All of this information typically lies within a proper data dictionary.
A data dictionary will allow anyone on your team an easy way to find any data-related topic, whether that’s understanding how to calculate closing ratio, where to find specific dashboards, or specific compliance policies related to a department. The data dictionary will serve both the data team and people looking to interact and make decisions with data.
Historically, there are two governance methodologies that data teams follow. The first is a top-down approach where they would put emphasis on control first and data access last.
The other uses a bottom-down approach which focuses on access first and control last. As you can clearly see, both of these strategies have fundamental flaws.
A more modern approach leverages a collaborative model and puts governance in the hands of business users known as data stewards. Data stewards are subject matter experts in each business unit and help maintain high data quality for the data assets that relate directly to their department.
This strategy requires detailed principles, documentation, and training to execute effectively but, the benefits outweighs the risks.
13. Gather feedback
Feedback loops is the process of generating feedback from stakeholders and other data users, and using that feedback to improve interactions, dashboards, data quality, and more.
While feedback loops are technically part of the agile methodology, I figured I would make a separate section so that we can dive a bit deeper, as it’s a very important process.
Feedback loops are a great framework for approaching the feedback process, and can be broken down into three simple steps:
1. Gather feedback
2. Analyze feedback
3. Act on feedback
Make sure to encourage feedback when communicating with data users after you’ve finished a task or project for them.
Say things like:
- “Don’t hesitate to reach out if you have any questions or concerns.”
- “Is there anything that can be improved on the dashboard we created for you?”
You can gather feedback by asking people to fill out a survey after a task or project is complete, include a link at the bottom of self-serve dashboards, or include a link in your email signature. Get creative with your approach, and maybe even offer an incentive if you’re having trouble getting people to give you feedback.
There are many tools out there that are great for gathering feedback. If your IT team doesn’t already have a survey tool, you might consider checking out Survey Monkey or Typeform. Both of these tools are extremely customizable and allow people to submit feedback anomalously, which is a great way to get the most raw insight you can get.

Pro Tip: Be sure to follow up with stakeholders to let them know what changes or improvements have been made as a result of their input. This will show that their feedback is valued and that their participation was meaningful.
14. Learn new skills
The data landscape is still in its infant stages, and the standards, tools, and use cases for data are growing rapidly. By 2025, it is estimated that the world will produce a mind-boggling 181 zettabytes of data.
With that being said, it’s important to continually push the needle and take the time to learn new skills. When making the decision on new things to learn, take a look at your roadmap and see if there are any skills that you can learn that will be align with the direction the company is going.
Check to see what learning resources your warehouse, ETL, and BI tool have to offer. Alternatively, Datacamp is a great platform for learning the most in-demand data skills, and has options for teams, so that you can assign specific learning tracks to people within the data team or other departments.
Conclusion
As we mentioned earlier, the data revolution is rapidly evolving so it’s important to revise your data strategy as you go, if not, every 6 months to a year. There are things that will likely change or may have not worked since you originally sat down and crafted your initial plans.
Moreover, nobody knows your business like you do so make sure you craft your plans to your unique business needs.
